)
Best Statistical Analysis Software and Tools in 2026
TL;DR
Most statistical analysis today happens in R and Python, while SAS, SPSS, Stata, and Minitab remain important in regulated and specialized industries. The right tool depends less on the statistical method itself and more on reproducibility, collaboration, compliance requirements, and integration with the rest of your data stack.
Statistical analysis tools are software platforms used to collect, clean, analyze, model, and interpret data. They support techniques such as hypothesis testing, regression analysis, time series forecasting, Bayesian inference, survival analysis, and multivariate modeling. Modern statistical workflows typically combine open-source languages such as R and Python with platforms that improve reproducibility and collaboration.
What you will learn
The best statistical analysis tools in 2026
How open-source and commercial statistical software differ
Which tools fit which kind of statistical work
How to evaluate a statistical analysis platform beyond the algorithm list
Where AI features add real productivity to statistical work
How to evaluate statistical analysis tools (a checklist)
Most statistical tools handle the standard methods. The differences show up in data preparation, reproducibility, scale, and what happens with the output.
Does the tool have the specific methods you need, with implementations you trust?
Can your analysis be reproduced when the data changes or someone else opens it?
Does it scale to the size of data you actually work with?
Is the technical bar appropriate for the team that will maintain the work?
Does it integrate with the rest of your data stack, or operate as a closed system?
Is the output defensible to a colleague, to a regulator, to a journal reviewer?
Open-Source Statistical Analysis Platforms
This is where most working statistical analysis happens in 2026. Open-source means free at the language level, with the cost being environment management and team-level reproducibility problems that platforms in this category solve in different ways.
Zerve: Reproducible Statistical Analysis Workflows
For statistical analysis that needs to hold up research that will be published, regulated work that will be audited, models that will be questioned, the binding constraint isn't the algorithm. It's reproducibility and traceability. Zerve supports Python and R in the same environment, so analysts can use the right tool for the method (R for survival analysis or mixed-effects models, Python for ML-adjacent statistical work) inside a DAG-based notebook environment that's reproducible by default.

The institutional knowledge layer matters specifically for statistical work because the methodology is the work, the choice of method, the assumptions tested, the diagnostics run. A regression model whose underlying assumptions aren't documented is a model that can't be defended six months later. For more on this problem, see our piece on institutional knowledge in data science.
Python and R in the same environment, on the same data
DAG-based notebooks for reproducible statistical pipelines
Institutional knowledge captures methodology alongside results
Scales from single-analyst work to team-level reuse
R: The Statistical Language
R was designed for statistics and it shows. The breadth and depth of statistical packages on CRAN exceed anything in the Python ecosystem, particularly for survival analysis, mixed-effects models, certain Bayesian methods, and the more specialized econometric and biostatistical methods. tidymodels brought a coherent modern API to R modeling work.
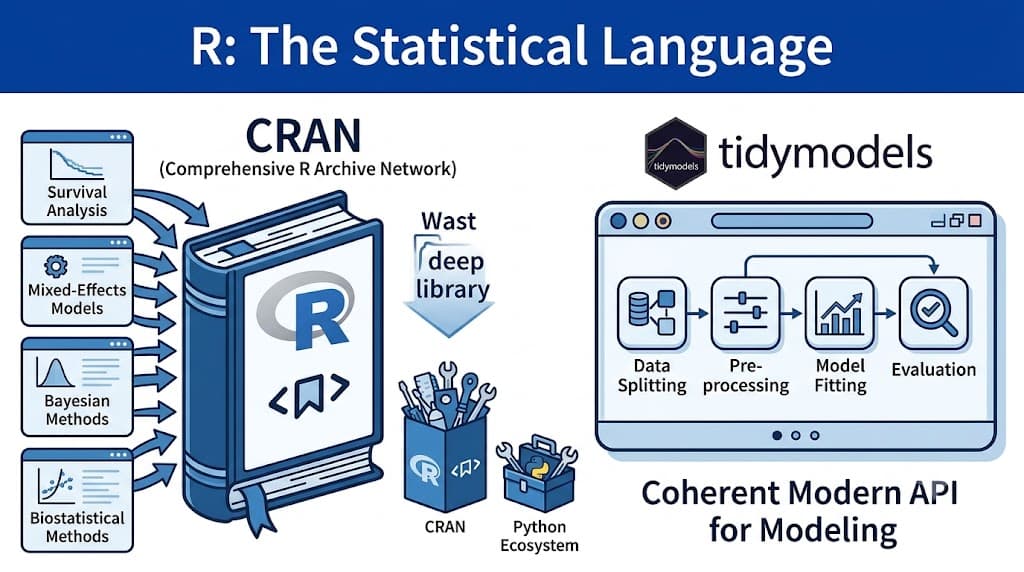
The widest statistical method coverage of any language
Stronger than Python for many specialized statistical methods
Best run inside a managed environment, not raw RStudio
Heritage in academic statistics shows in the tooling
Python (statsmodels, SciPy, PyMC): General-Purpose Statistical Work
Python's statistical ecosystem doesn't match R's depth for the more specialized methods, but it covers the common cases well and integrates much better with the broader data and ML stack. statsmodels handles regression, time series, and hypothesis testing; SciPy covers statistical tests and distributions; PyMC is the Bayesian workhorse.
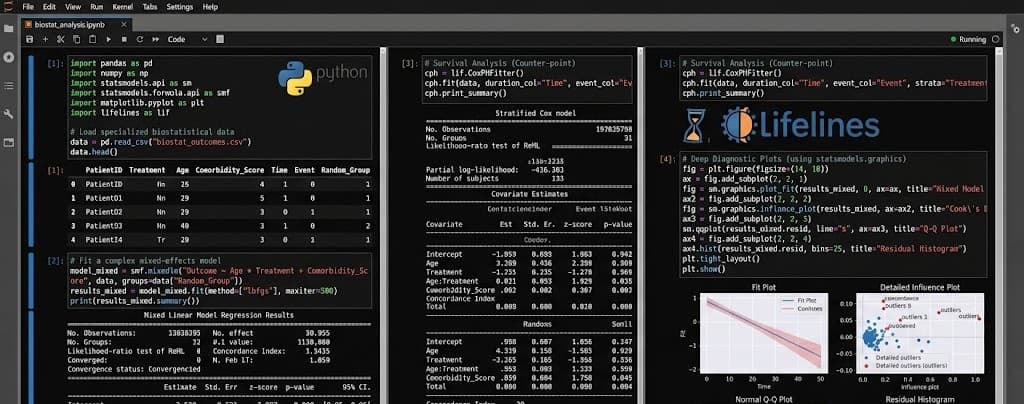
Covers the common statistical methods well
Better integration with the broader data and ML ecosystem than R
statsmodels, SciPy, and PyMC cover most working needs
Weaker than R for specialized methods (survival, mixed-effects, certain Bayesian)
Julia: High-Performance Statistical Computing
Julia is a smaller ecosystem than R or Python but it's earned a real foothold in statistical computing where performance matters: Bayesian inference (Turing.jl), large-scale linear algebra, computationally intensive simulations. The trade-off is a smaller package ecosystem and a smaller community.
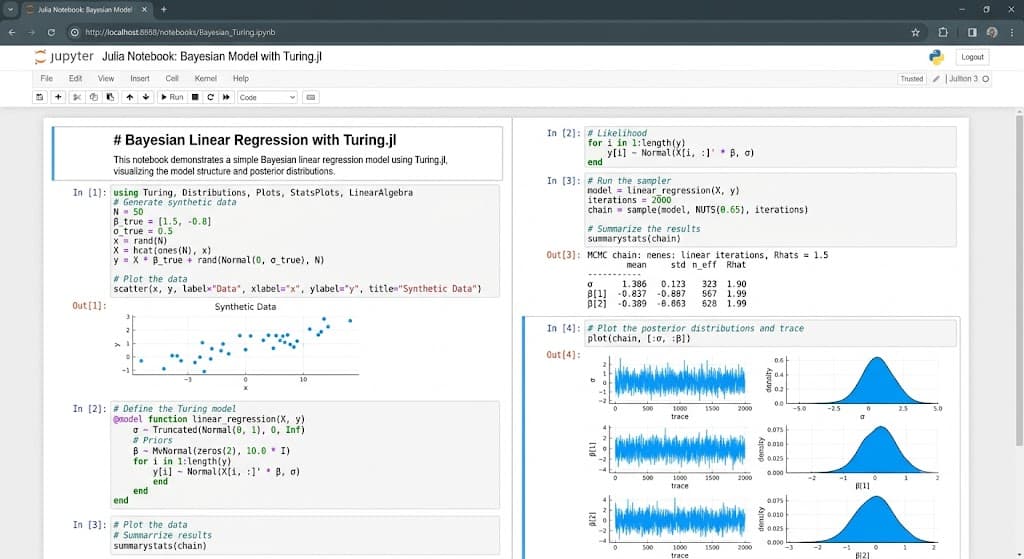
High performance for computationally intensive statistical work
Strong Bayesian ecosystem (Turing.jl, Stan-julia interface)
Smaller community and ecosystem than R or Python
Best fit for specific performance-sensitive use cases
Commercial Statistical Analysis Software
The commercial statistical suites still dominate in specific industries, clinical trials, certain regulated finance, government, parts of social science research. The reason is rarely "better statistics" and more often "long established workflows and audit trails."
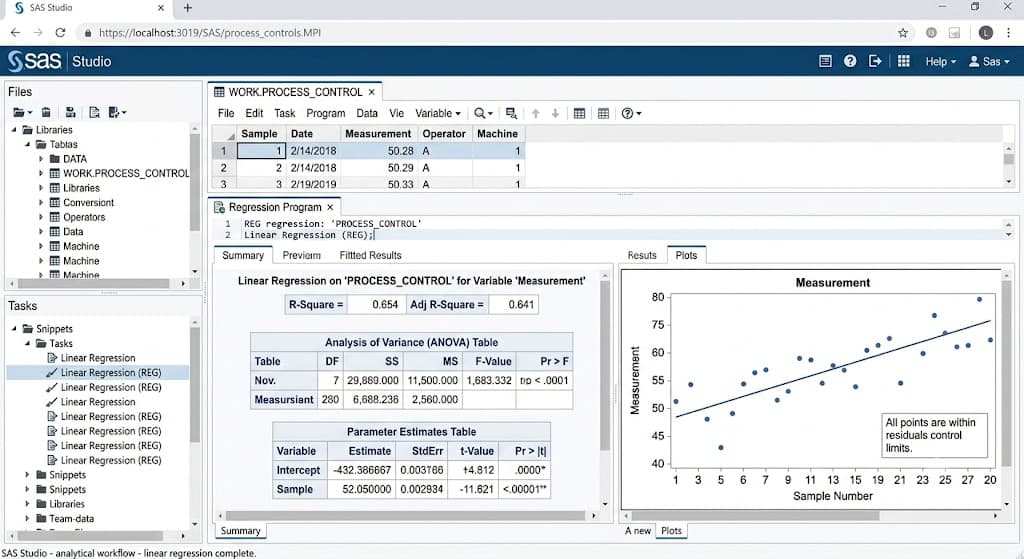
SAS: The Regulated Industry Standard
SAS has been the dominant statistical platform in clinical research, FDA submissions, and many regulated finance contexts for decades. The reason isn't superior statistics; open-source has caught up and often surpassed SAS, but the audit trail, the FDA acceptance, and the workflows organizations have built around it. SAS Viya, the modernized cloud platform, has added AI capabilities and a more open Python and R interoperability layer.
The default for clinical trials and FDA submissions
Long-established workflows and audit trails
Higher cost than open-source alternatives
Less compelling for new adoption outside regulated industries
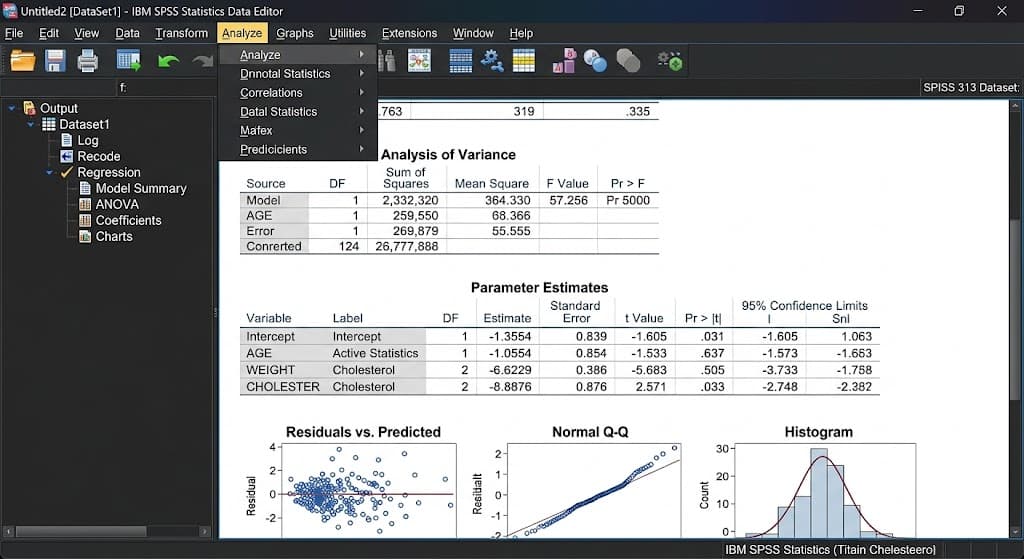
SPSS: Social Science and Survey Research
SPSS has been the default statistical tool in social science research since the 1970s. The GUI is approachable for non-coders, and the workflows for survey analysis and basic statistical testing are well-established. IBM has added Python and R extensibility, but the core experience remains menu-driven.
The default in social science and survey research
Approachable GUI for non-coders
Less flexible than R or Python for non-standard methods
Strongest fit for established SPSS shops, less for new adoption
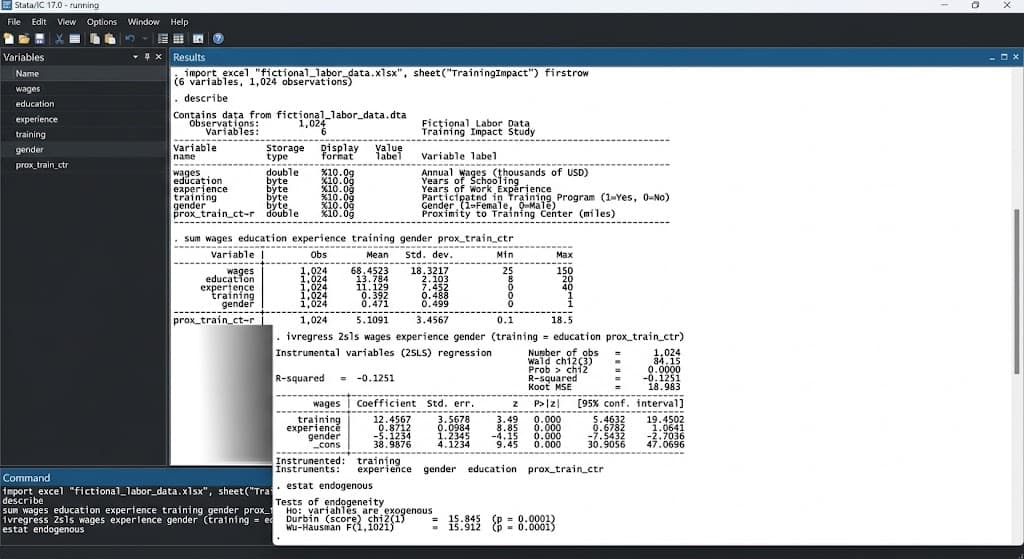
Stata: Econometrics and Health Research
Stata is the dominant tool in econometrics and health research. The command-line interface is more compact than SAS, the documentation is famously high-quality, and the user community is unusually committed. Adoption is heavily clustered in specific academic disciplines.
Heavy use in econometrics and health research
Excellent documentation and active user community
Smaller commercial ecosystem than SAS
Best fit for established Stata users in specific disciplines
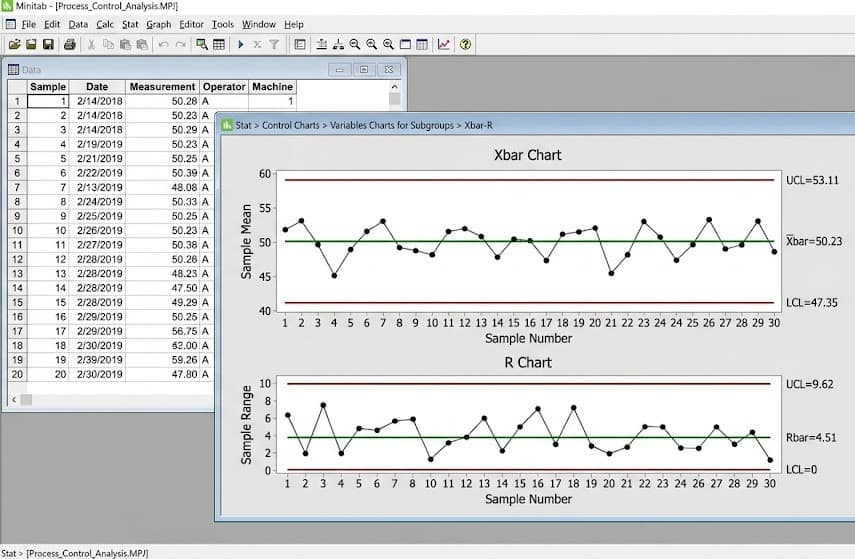
Minitab: Quality Engineering and Manufacturing
Minitab is the dominant statistical tool in quality engineering, Six Sigma work, and manufacturing analytics. The interface is built around the workflows of process control rather than general statistical analysis, which makes it the right answer for that specific work and the wrong answer for most others.
The default in quality engineering and Six Sigma
Optimized for process control and manufacturing workflows
Less general-purpose than other statistical tools
Strong fit for the specific industries where it dominates
AI-Augmented Statistical Analysis Tools
These are newer tools where AI is the primary interface. Most are useful for specific workflows but haven't replaced traditional statistical software for serious work.
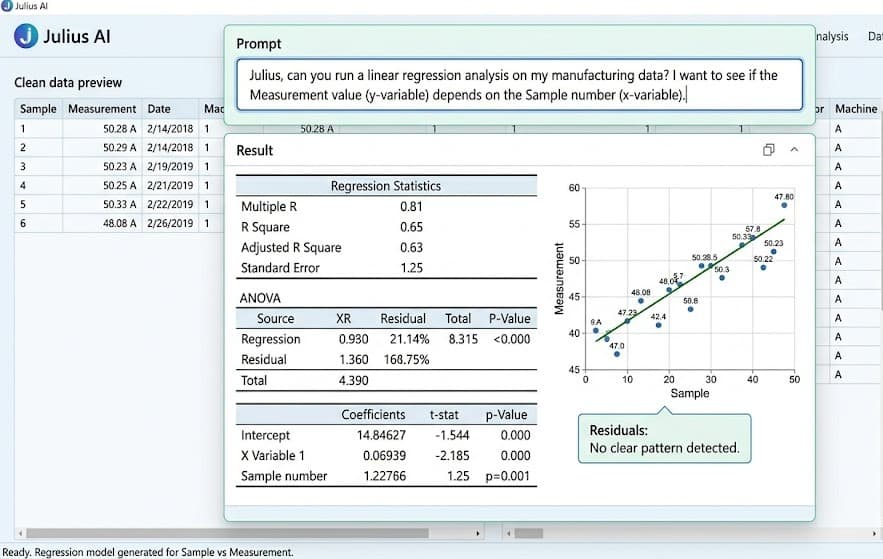
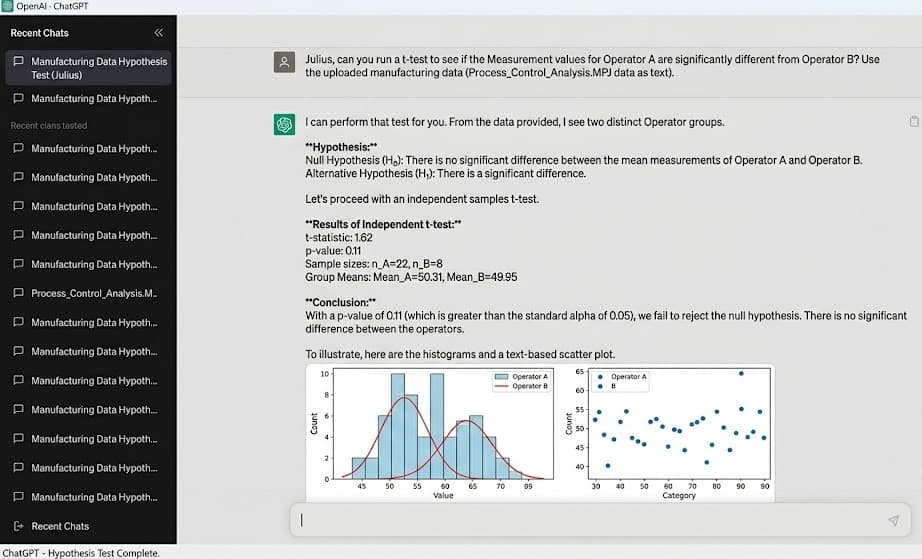
Julius AI: Conversational Statistical Analysis
Julius lets users upload data and ask statistical questions in natural language, run a regression, test a hypothesis, and generate descriptive statistics. Strong for fast answers from one-off datasets; less useful where the analysis needs to be reproduced, audited, or extended.
Conversational statistical analysis from uploaded data
Strong for one-off questions and quick exploration
Less suited to recurring or auditable statistical work
Accessible to non-statisticians
ChatGPT (with Code Interpreter): General-Purpose Statistical Work
ChatGPT's Code Interpreter runs Python on uploaded data, which means it can perform basic statistical analyses, hypothesis tests, regressions, and descriptive statistics from a prompt. Useful for fast exploration. Reproducibility and integration with the rest of a statistical workflow are weak.
Strong for one-off statistical questions
Output doesn't persist outside the conversation
Not a substitute for a real statistical environment
Useful alongside, not instead of, dedicated tools
Statistical analysis tools comparison
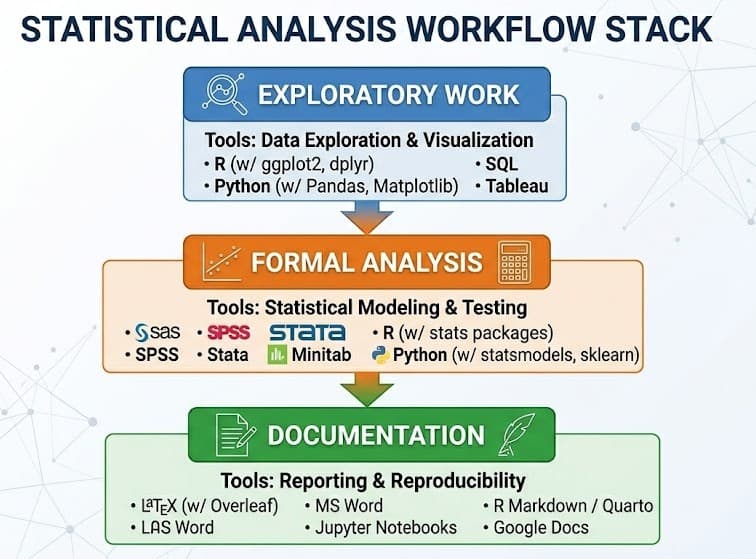
How statistical analysis stacks actually look
Most organizations don't rely on a single statistical analysis tool. They combine:
An analytical language such as R or Python for modeling and statistical methods
A collaborative environment where analyses can be reproduced, reviewed, and reused
Specialized software for regulated, academic, or industry-specific workflows
Problems usually appear when statistical work lives only on an individual's machine, making results difficult to reproduce, validate, or extend later.
Our predictive analytics for data teams guide covers how statistical analysis fits into the broader modeling pipeline.
Which statistical analysis tools fit each role
How to choose the right statistical analysis tool
Start with the methods you actually need. If you're doing standard regression, hypothesis testing, and descriptive analysis, almost any tool works; pick the one your team is comfortable with. If you need specialized methods (survival analysis, mixed-effects models, Bayesian inference at scale), the choice narrows. If the work needs to be reproducible, defensible, and rerun by other people, the question stops being about the language and becomes about the platform that hosts it.
For statistical work that needs to survive being reviewed, audited, or revisited, Zerve supports both Python and R in one reproducible environment. Start with Zerve free and build statistical workflows in Python and R inside a reproducible environment designed for collaboration, review, and long-term reuse..
Frequently Asked Questions
It depends on the work. For specialized statistical methods, R is still ahead. For general statistical work inside a broader data workflow, Python is more practical. For regulated industries, SAS is still the default. For reproducible team-level statistical work, a platform like Zerve that supports both Python and R fits most modern stacks.
R has wider statistical method coverage, particularly for specialized methods. Python has better integration with the rest of the data and ML ecosystem. Most working statisticians in industry use both. Platforms that support both in one environment let teams use the right tool for each method.
If you work in clinical trials, regulated finance, or established academic disciplines that have built workflows around these tools, yes. If you're starting fresh, the open-source ecosystem is faster, cheaper, and more flexible. The exception is when audit trails and regulatory acceptance are deal-breakers — that's where commercial tools still win.
Not for serious work. AI tools like Julius and ChatGPT can run basic statistical analyses from natural language, which is genuinely useful for fast exploration. But the analysis doesn't persist, isn't easily reproduced, and can't be audited. They complement traditional tools rather than replacing them.
Critical for any work that will be reviewed, audited, or repeated. A statistical model whose code, assumptions, and diagnostics aren't preserved is a model that can't be defended six months later. This is what separates a tool that's good for one-off exploration from one that's good for production statistical work.


