)
Top Financial Analysis Tools in 2026
TL;DR
Financial analysis tooling has fragmented hard since 2020. The tools that handle the spreadsheet end of the job aren't the same tools that handle modeling, and neither overlaps much with the quant research platforms used at pod shops and asset managers. This guide covers all three categories honestly, with notes on where each belongs. The phrase "financial analysis" hides at least three different jobs — corporate finance modeling, equity research, and quantitative investment research — and each has a distinct tool stack. We've grouped the tools by job, not by category, so the post is actually useful for someone picking a tool rather than browsing one.
Financial analysis tools are software platforms used to model financial outcomes, analyze company performance, evaluate investments, create reports, and conduct quantitative research. Common examples include Excel, Power BI, Bloomberg, FactSet, and Zerve
What you will learn
The best financial analysis tools in 2026, grouped by what they're actually used for
How spreadsheets, BI tools, and quant research platforms differ
Which tools fit corporate finance, equity research, and quant work
How to evaluate financial analysis software beyond the feature list
Where AI features are real productivity and where they're noise
How to evaluate financial analysis tools
Financial analysis tools are an unusually conservative market. Most teams use tools they picked five years ago, and the cost of switching is high. That means the evaluation needs to be sharper than for tools where you can experiment freely.
Does it produce output that can be defended in front of an auditor or LP?
Can the model or analysis be reproduced when the underlying data changes?
How does it handle the data sources you actually use — Bloomberg, FactSet, Refinitiv, internal data?
Does the team that will maintain the work match the technical level of the tool?
What's the lock-in cost if you adopt it and want to leave in three years?
Are the AI features actually useful, or are they a chat layer on top of unchanged software?
Spreadsheet-Based Financial Analysis
Spreadsheets are still the dominant tool in financial analysis and will be for a long time. The reason isn't inertia — it's that spreadsheets are the most flexible analytical surface ever built. The tools in this category extend that surface rather than trying to replace it.
Excel: The Default for Financial Modeling
Excel remains the default for financial modeling and the AI features added in 2024–2026 have made it meaningfully more productive. Copilot in Excel handles formula generation, pattern recognition, and data analysis from natural language prompts. The Python in Excel integration runs analytical Python directly inside the spreadsheet.
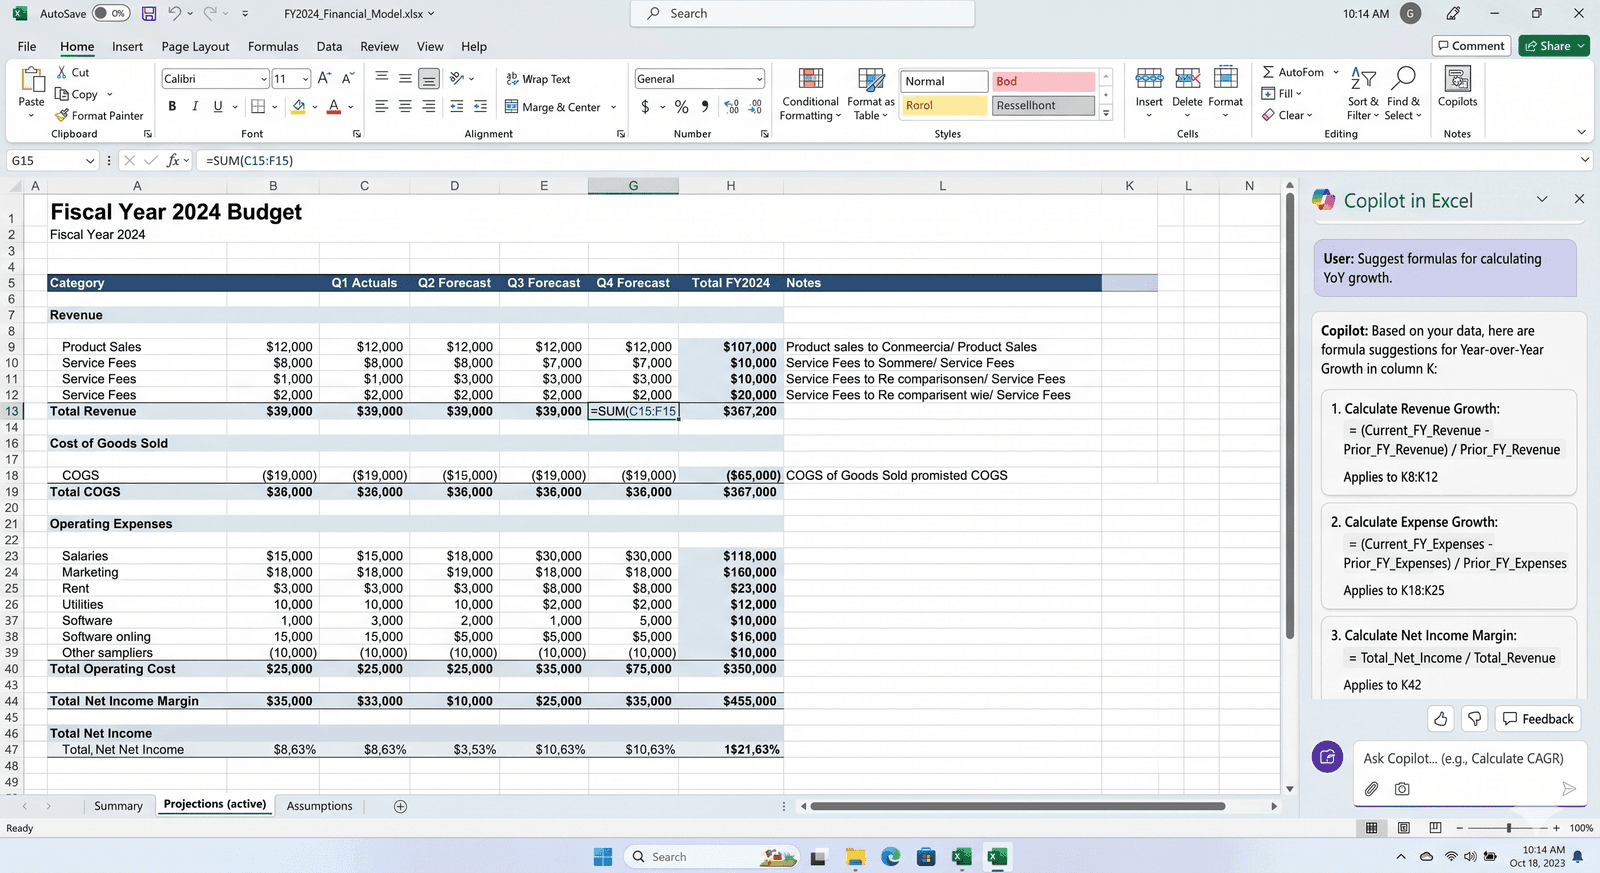
Still the dominant tool for financial modeling
Copilot for formula generation and natural language analysis
Python in Excel for serious analytical work inside the spreadsheet
Strongest fit for corporate finance, FP&A, and equity research
Google Sheets: Collaborative Financial Analysis
Google Sheets has caught up enough on financial functionality to be a credible Excel alternative for collaborative work, particularly at startups and smaller funds. Gemini integration handles formula generation, smart fill, and natural language exploration. The trade-off is depth — for complex financial models, Excel is still the more capable surface.
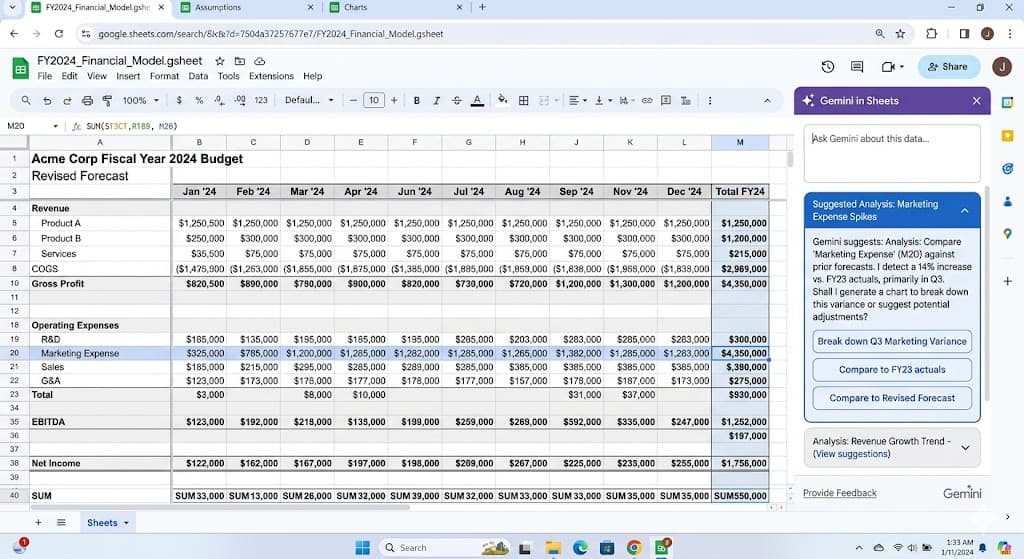
Strong collaborative model
Gemini AI for formula and analysis suggestions
Lower functional ceiling than Excel for complex modeling
Best fit for startups, smaller funds, and collaborative work
Causal: Modeling Without Spreadsheet Pain
Causal is positioned as the modern alternative to Excel for financial modeling — variables and dimensions instead of cells and formulas, scenario modeling built in, real-time collaboration. Strong fit for FP&A teams that want to escape spreadsheet pain without losing the modeling flexibility.
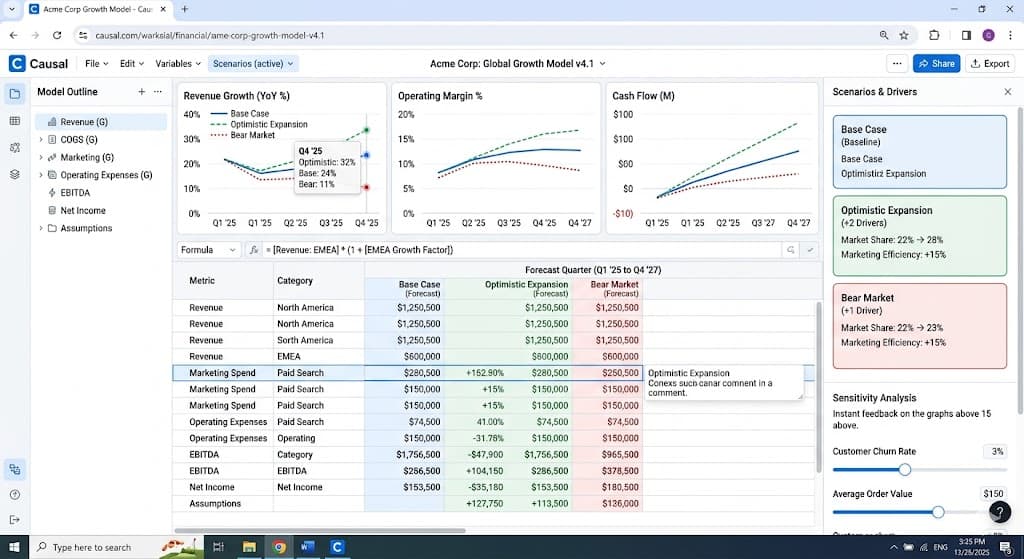
Modern modeling environment built around variables and scenarios
Strong scenario and sensitivity analysis features
Lower lock-in than Excel for moderately complex models
Less suited to highly bespoke or one-off models
BI and Analytics Tools for Finance
These are the tools financial teams use for reporting, dashboarding, and analysis on top of warehouse data. Most large finance organizations have at least one of these alongside their spreadsheet stack.
Power BI: Financial Reporting in Microsoft Shops
Power BI is the dominant BI tool in finance functions standardized on Microsoft — which is most of them. The integration with Excel, PowerPoint, and Teams makes it the path of least resistance for financial reporting that needs to be both modeled and shared.

Native to Microsoft 365 environments
Copilot for natural language financial queries
Strong integration with Excel for hybrid workflows
Default choice for enterprise finance teams
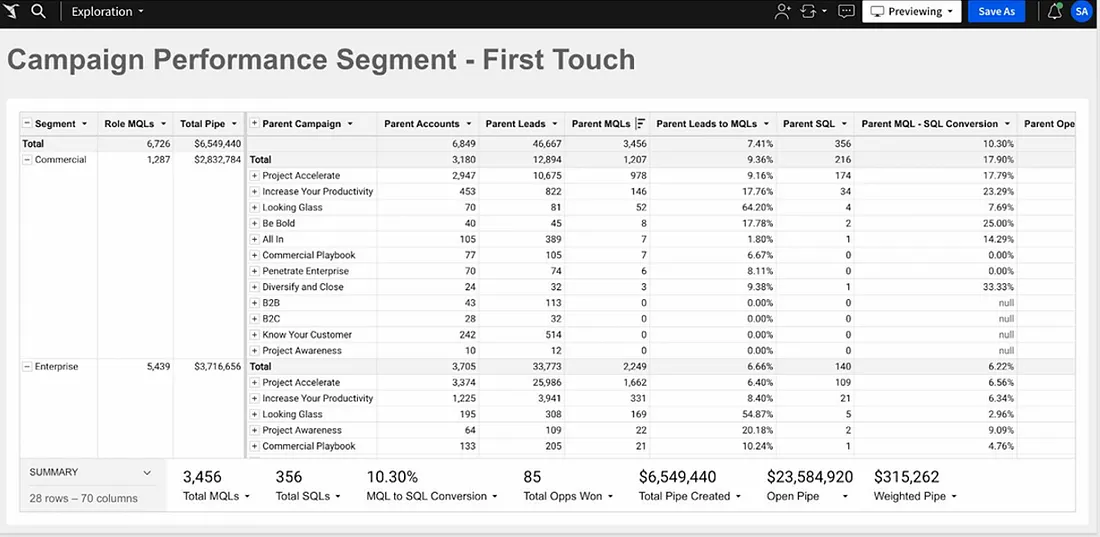
Tableau: Visual Financial Analysis
Tableau's visual depth makes it a strong fit for the more exploratory side of financial analysis — variance walks, segment analysis, scenario comparisons. Tableau Pulse delivers metric alerts to Slack or email, which is useful for the kind of monitoring that finance teams need to do continuously.

Strong visual analysis for variance and segment work
Tableau Pulse for continuous monitoring
Wider community of finance-specific Tableau examples
Premium pricing tier
Sigma: Spreadsheet UI on a Cloud Warehouse
Sigma's pitch is the spreadsheet UI over a cloud warehouse, which lands particularly well in finance. Analysts can write Excel-style formulas against warehouse-scale data without writing SQL, which removes a friction point for finance teams used to spreadsheets.
Spreadsheet UI over Snowflake, BigQuery, Databricks
Familiar to finance teams coming from Excel
AI formula generation and natural language queries
Strong fit for FP&A and finance ops
Quantitative Research Platforms
This category is distinct. The tools here are used by quant researchers at hedge funds, pod shops, prop trading firms, and systematic asset managers. The work isn't financial reporting — it's signal research, backtesting, model development, and systematic strategy work.
Zerve: Reproducible Quantitative Research
The binding constraint in quant research isn't compute or model sophistication. It's human bandwidth. The researchers defining the next decade aren't running ten backtests — they're running a thousand in parallel, with agents that critique each other's work. Zerve is built for that: a DAG-based notebook environment where research can fan out across compute, with institutional knowledge captured alongside the code so that a strategy from eighteen months ago isn't a black box.
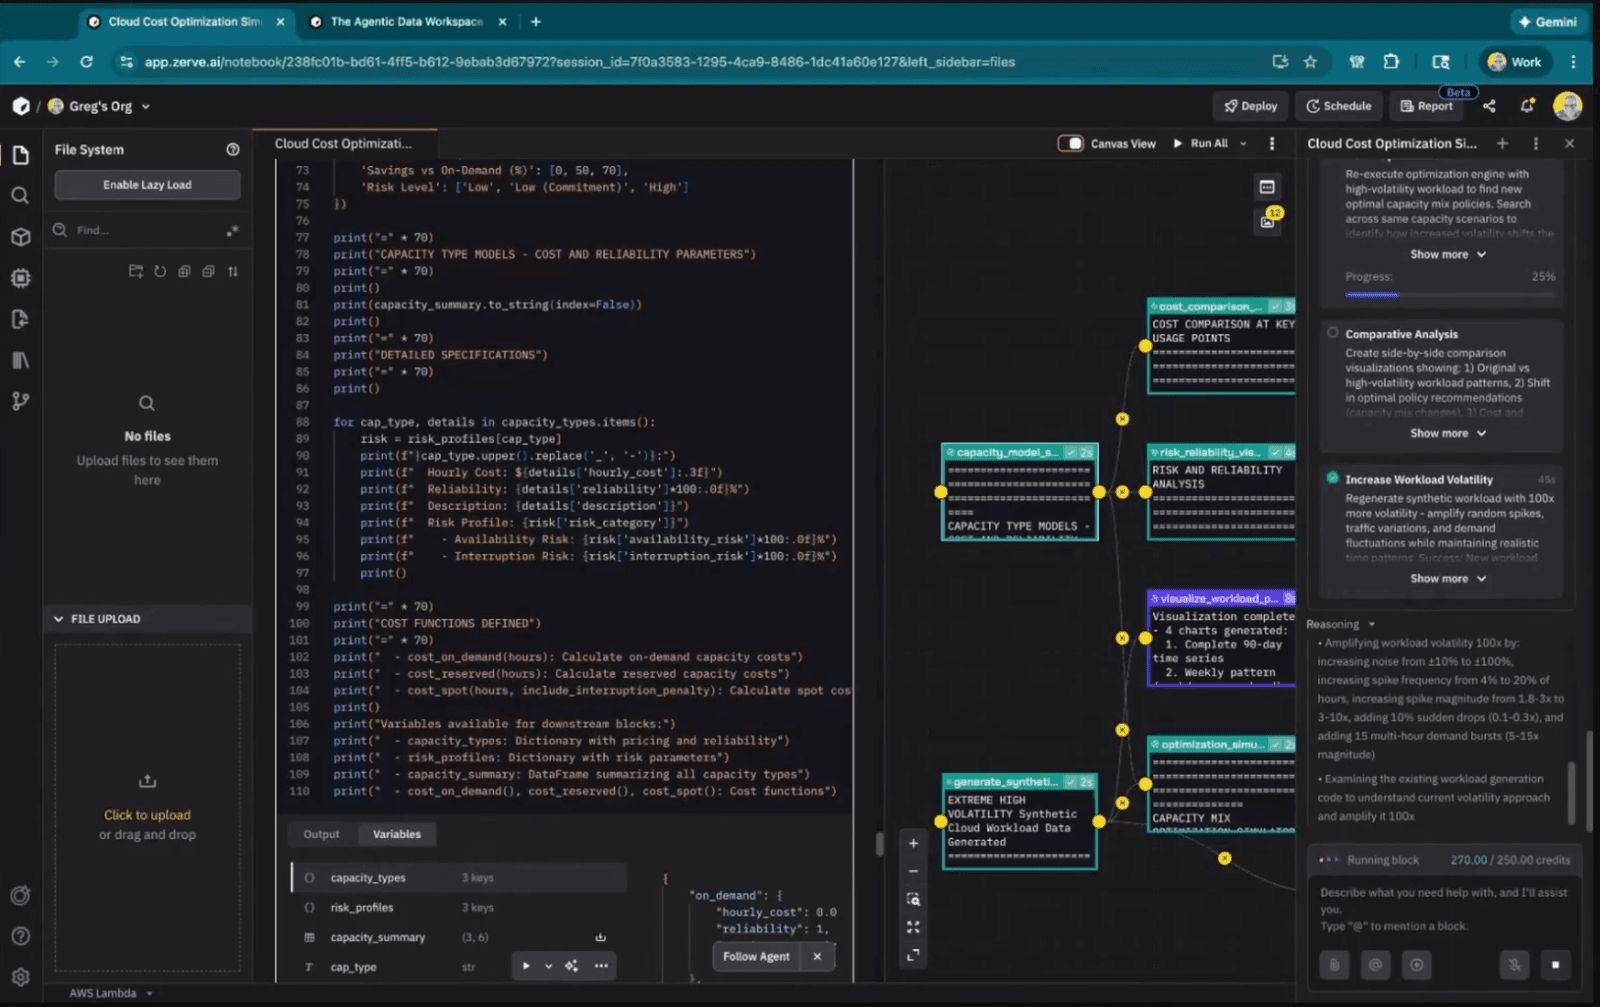
Python and R coexist in the same environment, which matters more than it sounds for quant work — most mature research stacks mix Python's ML ecosystem with R's statistical depth. For a longer view of where Zerve fits in this category specifically, see our piece on LLMs in quantitative research and our overview of the quant researcher use case.
DAG-based notebooks for parallel, structured research workflows
Python and R in the same environment for the full quant stack
Institutional knowledge captures the why behind every strategy
Built specifically for the bandwidth constraint of modern quant research
Bloomberg Terminal: The Industry Default
The Bloomberg Terminal is the default data and analysis surface for the buy and sell side, and the 2024–2026 BQuant additions have brought a more analytical layer on top of the terminal's data. For most working financial analysts, Bloomberg is less optional than every other tool in this list.
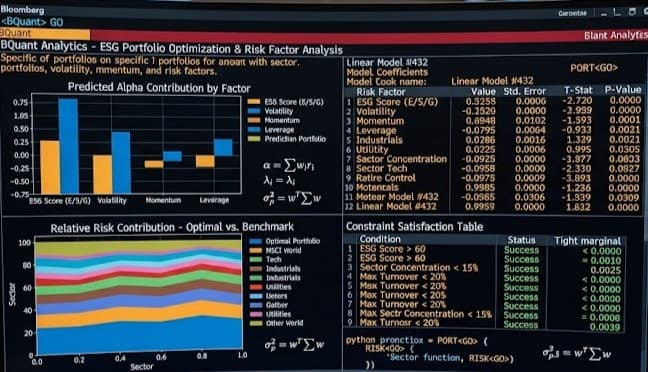
The default data source for institutional finance
BQuant adds analytical capabilities on top of the terminal
Significant subscription cost
Industry-standard for equity research and fixed income
FactSet: Bloomberg Competitor with Stronger Modeling Tools
FactSet competes with Bloomberg on data and pulls ahead on certain modeling and portfolio analysis features. The Mercury LLM-based assistant, launched in late 2023, handles natural language data retrieval and analysis directly inside the platform, and has since become the core of FactSet's Intelligent Platform initiative.
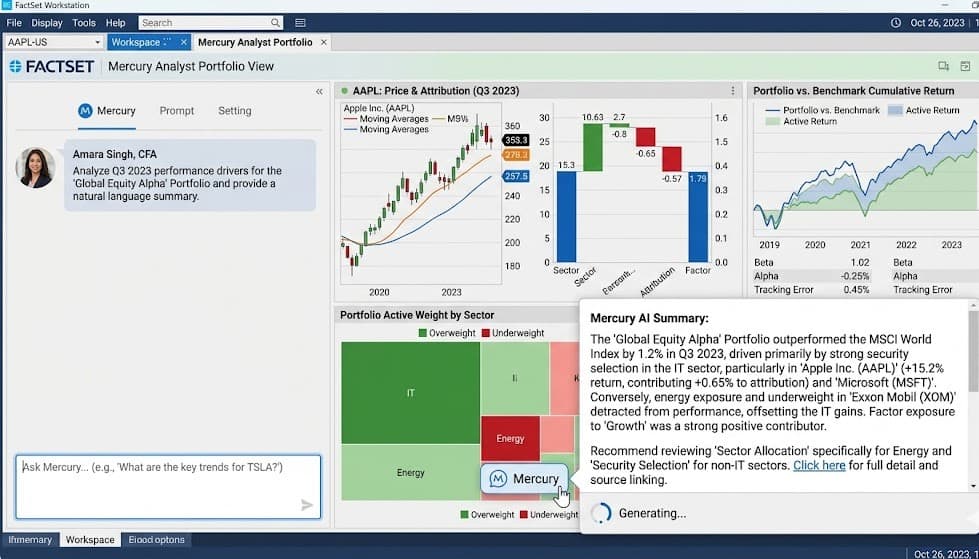
Stronger modeling and portfolio analysis than Bloomberg
Mercury AI assistant for natural language work
Significant subscription cost
Common alongside or instead of Bloomberg in equity research
Q (kdb+): The Standard for High-Frequency Time Series
For tick-data work and high-frequency time series, kdb+/q remains the standard. The query language is famously unusual, but for microsecond-resolution data at scale, no general-purpose tool comes close. Most quant teams that touch market microstructure run kdb+ somewhere in the stack.

The standard for high-frequency time series and tick data
Unmatched performance at scale
Steep learning curve
Often used alongside Python/R for downstream analysis
AI-Augmented Financial Analysis Tools
The category here is newer — tools where AI is the primary interface rather than an added feature. Most are useful for specific workflows but haven't displaced the established platforms yet.
Julius AI: Conversational Financial Analysis
Julius lets users upload financial data and ask questions in natural language. For finance teams that need fast answers on a one-off dataset, this works well. Reproducibility and integration with the rest of a finance stack are weaker — the analysis lives in the conversation, not in a versioned workflow.

Conversational financial analysis from uploaded data
Strong for fast answers on one-off datasets
Less suited to recurring or auditable work
Accessible to non-technical finance users
ChatGPT (with Code Interpreter): General-Purpose Financial Analysis
ChatGPT's Code Interpreter runs Python on uploaded data, which means it can perform basic financial analysis from a prompt — DCF calculations, ratio analysis, scenario modeling. Useful for fast exploration, less useful as a recurring part of a finance workflow.
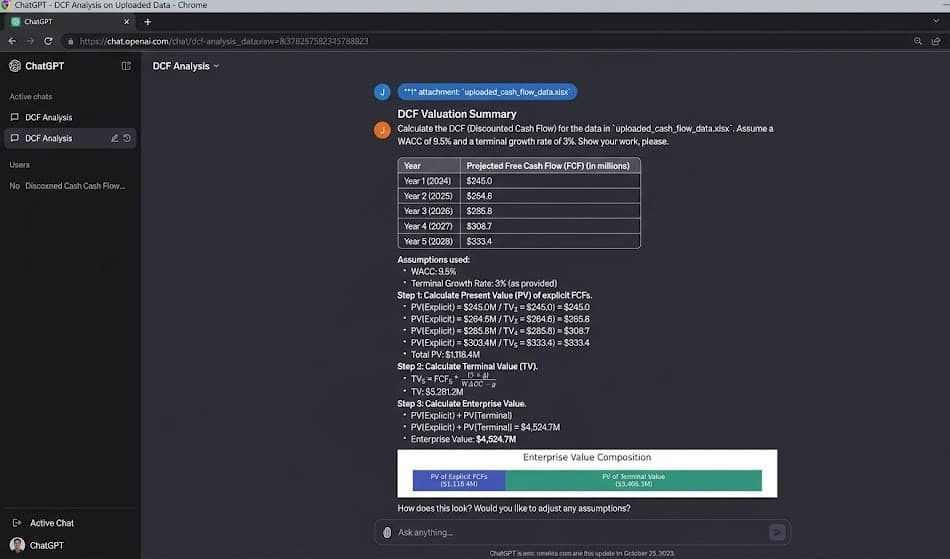
Strong for one-off financial calculations and exploration
Output doesn't persist outside the conversation
Not a substitute for a real modeling or research environment
Useful as a drafting partner alongside other tools
Financial analysis tools comparison
How financial analysis stacks actually look
Most finance teams in 2026 run three distinct tool layers. A spreadsheet layer for modeling. A reporting layer for dashboards and recurring outputs. A specialized layer for the work that doesn't fit cleanly into either — quant research at funds, BQuant work at sell-side desks, Python or R analysis for ad-hoc questions. The teams that struggle are the ones trying to force all three jobs through Excel, or trying to force all three through Power BI. Our data analytics platform evaluation guide covers the criteria for choosing the right tool for each layer.
Which financial analysis tools fit each role
How to choose the right financial analysis tool
The starting question is what kind of financial analysis the work actually is. Modeling lives in spreadsheets, and Excel is still the right answer for most modeling jobs. Reporting and recurring dashboards live in BI tools — Power BI for Microsoft shops, Tableau or Sigma elsewhere. Research that needs to be reproducible, defensible, and run at scale — particularly quantitative research — needs a different category of tool entirely.
For quantitative research specifically — where the bottleneck is rarely the data and almost always the bandwidth to test more ideas — Zerve was built from the ground up for that work. Start with Zerve free and run your first research workflow inside an environment designed for it.
Frequently Asked Questions
There isn't a single best tool. Excel remains dominant for modeling. Power BI and Tableau dominate reporting. Bloomberg and FactSet dominate equity research data. For quantitative research, Zerve, the Python and R ecosystem, and kdb+ for tick data. Most working stacks combine three or four.
Not in 2026. AI tools have reduced the time spent on routine work — formula generation, summarization, data preparation — but the judgment that financial analysis is paid for (interpreting numbers, defending assumptions, advising on decisions) is still done by people. The analysts who win are the ones using AI tools effectively, not the ones being replaced by them.
Financial analysis covers a broad set of jobs — modeling, reporting, equity research, FP&A — most of which involve historical data and forward projections. Quantitative research is a narrower discipline focused on systematic, often statistical, strategy development. The tool stacks are mostly different.
Use Excel for modeling, especially anything bespoke or one-off. Use Power BI (or Tableau) for recurring dashboards and reporting. Use a programming language — Python or R inside a platform like Zerve — for work that needs to scale, run automatically, or be reproduced. Most finance teams use all three.
The honest answer is "sometimes." Copilot in Excel saves real time on formula generation and pattern recognition. Mercury in FactSet and BQuant in Bloomberg have clear use cases. Some other AI features are chat layers on top of unchanged software and don't really change the work. Evaluate based on your actual workflow, not the marketing.


