)
Top AI Tools for Business Analysis in 2026
TL;DR
Business analysts in 2026 aren't choosing one AI tool, they're building a stack. This guide covers the tools that handle recurring reporting, ad-hoc questions, auditable analysis, and the documentation layer most teams skip.
Every analytics vendor has an AI story in 2026. Knowing which tools actually belong in a business analysis workflow takes more than reading the feature list. We’ve compiled what we believe to be the Top AI Tools in 2026 for Business Analysis.
What you will learn:
Best AI tools for business analysis in 2026
Zerve vs other AI analytics platforms: reproducibility and collaboration compared
AI assistants vs analytics platforms vs BI tools: what is the difference
Which AI business analysis tool is right for my role
AI business analysis tools comparison: features, use cases, and technical requirements
How to Evaluate AI Tools for Business Analysis (A Checklist)
Start with your most common analysis request and see how far you get without help from your data team. Then try something messier, a dataset with gaps, inconsistent formatting, or a question that requires combining two sources. The tools worth building a workflow around handle both.
Does it work on your actual data, not a clean sample?
Can someone who wasn't involved open the output and understand how you got there?
Does it slot into your existing workflow or require rebuilding around it?
Can the work be picked up and rerun a month later?
Does the output hold up when someone asks follow-up questions?
Is the technical bar low enough that the right person on your team can actually use it?
AI Assistants for Data Exploration
Most analysis starts with a question that doesn't need a dashboard. These tools handle that layer, fast and without setup.
ChatGPT: Fast, Flexible AI Analysis Support
With ChatGPT, most analysts use it the same way; paste in a dataset, describe what you need, and it writes the query or the formula. That's how most analysts use it, and it works well for that. Without a live data connection or a Custom GPT setup with API integration, it stays at the edges of a workflow rather than inside it.

Strong at SQL drafting, formula debugging, and translating results into plain language
Good for structuring analysis before opening a BI tool
Works best alongside other tools rather than as a standalone solution
Julius AI: Conversational Analysis for Uploaded Data
Unlike general-purpose AI tools that treat file analysis as a secondary feature, Julius was built around it. Native database connections to SQL Server, MySQL, and Databricks are supported, and file sizes up to 32 GB work without the limits you hit elsewhere.

Built for conversational analysis of uploaded files and connected data sources
Generates charts and summaries from natural language input
Accessible for non-technical users who need fast answers from structured data
AI-Native Analytics Platforms for Business Analysis
The Q&A tools answer questions. The platforms in this category do the work behind them, and keep a record of how it was done. Here’s the top recommended tools for AI data analytics.
Zerve: Reproducible Business Analysis Workflows
With Zerve, coding environments, datasets, and AI assistance all live in the same shared environment, so anyone on the team can open a piece of work, run it, and trace how a number was derived. That traceability is the whole point; without it, the output exists but the reasoning behind it does not.

At the UNC Charlotte "From Events to Outcomes" Datathon, nearly 100 students used Zerve to dig into real platform data over a weekend. The winning team's findings on user retention were specific enough that Zerve's own product team pulled up the slides twice in the following week. At a separate Unstop hackathon, one participant built a complete autonomous bidding engine inside the competition window, cutting cost per acquisition from $15.70 to $1.72. His note: "It bridges the gap between 'Data Science Experiment' and 'Production Microservice.'"

Combines notebooks, datasets, and AI assistance in one environment
Analysis workflows are structured to be reviewed, reused, and updated over time
Built for collaborative teams working on questions that require real depth
Supports the full path from exploration to production-ready insights
Databricks: AI-Assisted Analysis at Scale
Most teams hitting Databricks for the first time underestimate how much setup is involved before anything useful happens. Once the infrastructure is in place, 2025 added real analytical depth: native AI functions in SQL for summarization, classification, and document parsing, all without leaving the warehouse.

Best suited for teams with serious data infrastructure and engineering capacity
AI-assisted notebooks and native AI SQL functions reduce friction on complex data work
Supports ML model development alongside standard business analysis
Business Intelligence Tools with AI Features
BI tools exist so analysts aren't rebuilding the same report every time someone has a question. Here’s a look at some of the top performers.
Power BI: AI-Powered Enterprise Business Intelligence
Organizations already running on Azure and Microsoft 365 will find very little friction getting Power BI into the workflow. Anomaly detection flags unusual metric shifts with natural language explanations, the Q&A feature handles typed questions without analyst involvement, and forecasting runs on time-series data without any modeling setup.

Native integration with Microsoft 365 and Azure
Anomaly detection, forecasting, and natural language Q&A built in
Strong choice for enterprise teams standardized on Microsoft tools
Tableau: AI-Enhanced Data Visualization for Business Teams
Tableau's visualization has been best-in-class for years, and the 2024 shift from Ask Data to Tableau Agent and Tableau Pulse moved the AI layer from a standalone feature to something embedded in how people actually work. Tableau Agent handles conversational queries and generates calculations; Pulse delivers metric alerts and plain-language summaries directly into Slack or email.

Visualization quality remains best in class
Tableau Agent and Pulse replace older NLP features with more capable, workflow-integrated AI
Strong ecosystem of community resources and shared workbooks
Looker: Scalable BI and Shared Business Analytics
At small team sizes, metric consistency tends to happen informally. Past a certain scale, the revenue number in the sales dashboard stops matching the one in the finance report, and figuring out why becomes its own project. Analysts define dimensions and measures once in LookML, and every dashboard in the organization queries from those same definitions.

Shared data models keep metrics consistent organization-wide
Better fit for teams that have outgrown decentralized, ad-hoc reporting
Integrates tightly with Google Cloud and BigQuery
AI Tools for Business Reporting and Documentation
Getting the numbers is one job. Getting them into a format anyone else can use is another. These tools handle the second one.
Notion AI: AI-Assisted Analysis Documentation
Analysis produces a lot of context that tends to disappear: why a metric was defined a certain way, what the team decided and what changed their minds. Notion AI is useful here specifically because it turns rough notes into something a non-participant can follow, not because it does anything new with the underlying data.

Helps translate raw analysis into structured documentation
Useful for drafting memos, summaries, and decision write-ups
Fits naturally into teams already using Notion for knowledge management
Google Sheets: AI Features for Collaborative Business Analysis
A lot of business analysis still starts in Sheets regardless of what else a team has, and the Gemini integration has made that familiar environment meaningfully faster. Smart fill, formula suggestions, and natural language formula generation are incremental features that add up over the course of a week.
Smart fill and formula suggestions reduce manual work on common tasks
Gemini adds natural language capabilities to a familiar environment
Best for lightweight analysis and quick collaboration within Google Workspace
AI Business Analysis Tools Comparison
The table below compares all nine tools across the dimensions that matter most for business analysis work. Technical level reflects what it takes to get started, and every tool here has users doing more with it than the category suggests.
How Business Analysts Use AI Tools in Practice
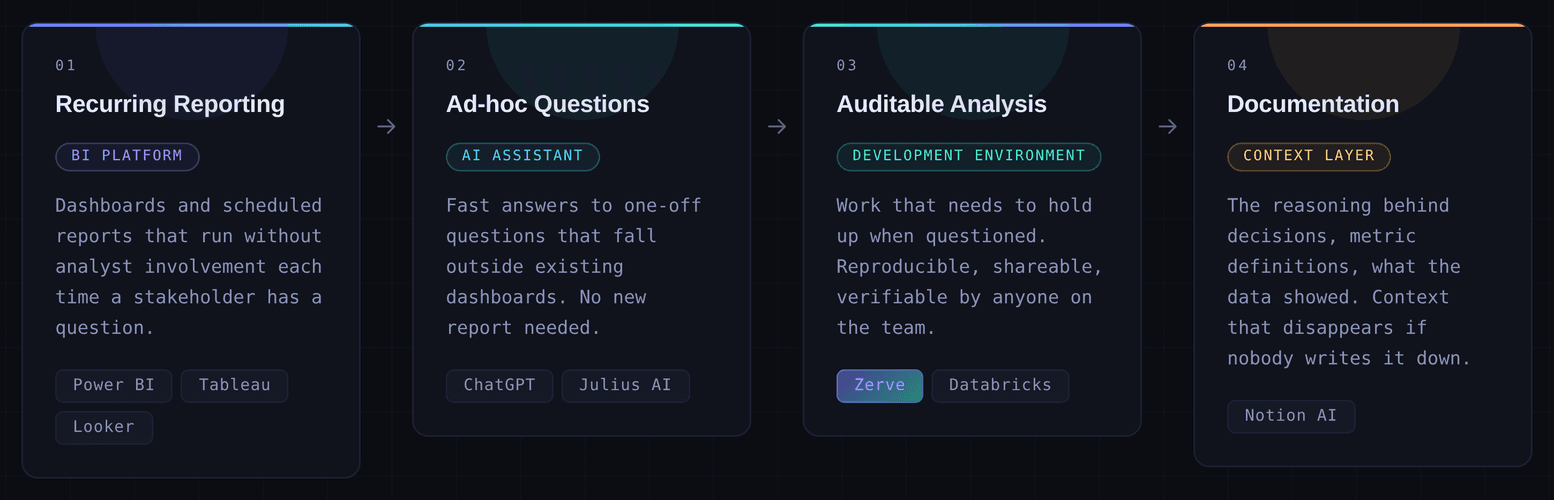
Most teams run a BI platform for recurring reporting, an AI assistant for questions that fall outside existing dashboards, and a deeper analysis environment for work that needs to hold up when questioned. The documentation layer is the part that most stacks skip entirely and then miss later.
Which AI Business Analysis Tools Fit Each Role
The right tool depends partly on what you're analyzing and partly on what your job requires you to do with the output. A founder needs fast answers they can act on. A data analyst needs something they can defend. Those are different problems, and they point to different tools.
How to Choose the Right AI Tools for Your Business Analysis Stack
Look at where your workflow actually slows down. Ad-hoc questions going unanswered for days, analysis nobody can reproduce, reports that break when the data changes. Each of those problems has a tool in this list, and most stacks end up solving them with two or three tools working together rather than one.
If reproducibility and auditability are the gap, that's where to start. Zerve has a free tier and takes minutes to get started. Try Zerve free and run your first analysis before you finish evaluating anything else.
Frequently Asked Questions
The strongest stacks combine a BI platform for recurring reporting, an AI assistant for ad-hoc questions, and a development environment like Zerve for auditable, reproducible analysis. The best individual tool depends on your role, technical level, and whether your work needs to hold up to scrutiny.
AI assistants like ChatGPT are good for fast, conversational answers to one-off questions. AI analytics platforms like Zerve are built for structured, reproducible work where methodology matters and results need to be shared, versioned, and verified
Yes. Tools like Power BI, Tableau, and Looker are designed for non-coders and include AI-assisted features for querying and summarizing data. Tools like Zerve are built for analysts who work in code and need a more structured environment for that work.
AI tools reduce the time spent on manual data preparation, surface patterns that would take longer to find by hand, and make it easier to answer stakeholder questions without building a new report from scratch every time.
The most important factors are reproducibility, how well the tool fits your existing stack, whether outputs can be shared and verified by others, and whether it supports the kind of analysis you do most, whether that is ad-hoc exploration, recurring reporting, or production-grade modeling.


