Abstract digital image showing a grid of dark circular nodes with one glowing orange diamond-shaped node in the center, symbolizing focus, activation, or a key process within a system.

How to Detect Rare Instances of Fraud Automatically, at a Vast Scale

See how automated orchestration cuts manual effort and makes anomaly detection faster, reproducible, and scalable.

Detecting fraud is tough because fraud cases are less than 0.2% of all transactions. Recently several of our customers have been working on similar use cases, and I wanted to share how they are doing it at a massive scale with an agentic workflow.

To demonstrate this, I built a detailed anomaly detection system to analyze the Credit Card Fraud Detection dataset from Kaggle. The goals were to test different anomaly detection methods, find the best one, and set up an easy process for retraining and deployment with little manual work.

You can follow along in this Zerve Canvas.

The Challenge: Extreme Class Imbalance in Anonymized Data

Screenshot of a project documentation notebook titled “Credit Card Fraud Detection Project: End-to-End Overview.” The text describes the project’s context and dataset characteristics, detailing that it uses 284,807 transactions with 31 columns, features V1–V28, Time, Amount, and Class. It highlights data imbalance with only 0.17% fraud cases and confirms there is no missing data.

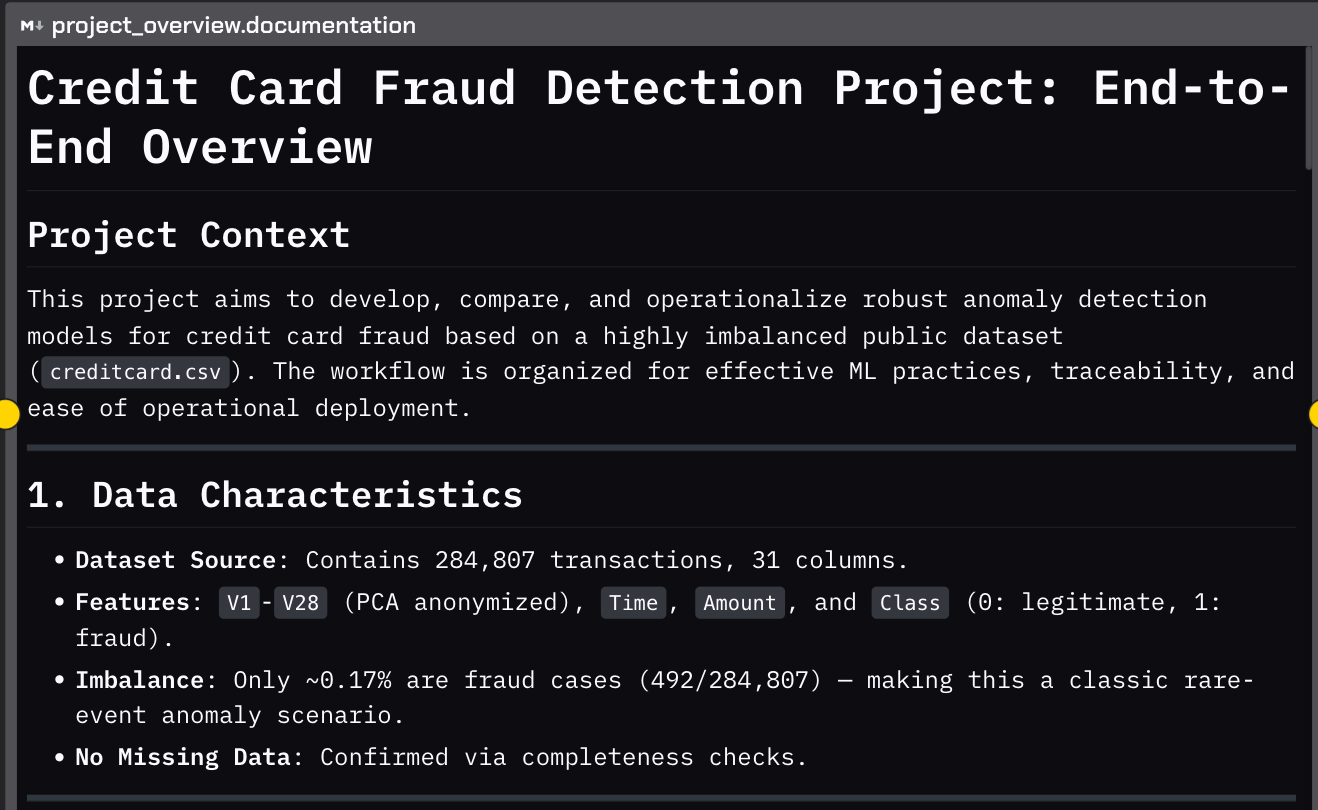
The dataset has 284,807 transactions from European cardholders. Only 492 of these are fraud, which is just 0.172%. Features V1 to V28 are hard to understand because they come from PCA projections. The dataset also includes real values for Time and Amount, and a Class label where 1 means fraud and 0 means a normal transaction. This data is high dimensional, anonymized, and very unbalanced, making it ideal for testing anomaly detection methods.

Why Automate the Workflow?

Doing this project manually means repeating preprocessing steps, adjusting thresholds by hand, collecting metrics inconsistently, and risking mistakes.

Using Zerve's agent for Data Science to build an automated workflow, it allowed me to:

  • Apply the same preprocessing for both training and inference

  • Test multiple models in a consistent way

  • Record every change, threshold, and metric

  • Retrain and redeploy with just one pipeline run

Data Understanding & Preprocessing

We used z-score scaling at the beginning to standardize all numerical features for consistent results. The data was split into training and testing sets using stratified sampling, 80% for training and 20% for testing, to keep the rare fraud cases balanced. These steps were included in a reusable Zerve pipeline that processes all new batches of transactions in the same way.

Screenshot of a Zerve workflow showing connected blocks for loading and preprocessing a credit card dataset. The blocks include steps for loading data, checking for missing values, scaling features, stratified train-test splitting, and exploring class imbalance. The visual flow illustrates the data pipeline structure and outputs such as fraud ratio and dataset shapes.

Model Portfolio and Training Approach

We tested different unsupervised and supervised models to detect anomalies:

  • Isolation Forest – Uses trees to score anomalies based on path length

  • One-Class SVM – Separates normal transactions by defining boundaries

  • Autoencoder – Detects anomalies by measuring reconstruction errors

  • Deep SVDD-style AE – Learns a tight feature space around normal data

  • Elliptic Envelope – Assumes normal data follows a multivariate Gaussian distribution

  • HBOS – Scores outliers using histograms

We trained the models using only Class=0 (normal) transactions so they could learn typical patterns. For neural network models, we used a validation set to choose anomaly thresholds dynamically.

Screenshot of a Zerve notebook showing Python code for training and evaluating an Isolation Forest model with Scikit-learn. The output panel displays performance metrics including AUPRC 0.16108, precision 0.03534, recall 0.83673, and F1-score 0.06782, along with a confusion matrix and a precision-recall curve labeled “Isolation Forest Fraud Detection.”
Screenshot of a Zerve notebook block showing Python code for training and evaluating a One-Class SVM model using Scikit-learn. The output includes fraud detection metrics such as AUPRC (0.35654), precision (0.12), recall (0.83), F1-score (0.21), and a confusion matrix, along with a plotted precision-recall curve labeled “One-Class SVM Fraud Detection.”
Screenshot of a Zerve notebook showing Python code for training and evaluating an autoencoder using Scikit-learn’s MLPRegressor. The output panel lists iteration numbers and corresponding loss values, illustrating the model’s convergence over time during training on legitimate (non-fraud) data.
Screenshot of a Zerve notebook showing Python code for training and evaluating an Elliptic Envelope model using Scikit-learn. The output panel includes metrics with AUPRC of 0.01587, zero precision, recall, and F1-score, along with a confusion matrix and a precision-recall curve indicating poor model performance on fraud detection.
Screenshot of a Zerve notebook showing Python code for training and evaluating an HBOS (Histogram-Based Outlier Score) model using PyOD and Scikit-learn. The output includes AUPRC 0.28802, precision 0.01522, recall 0.90816, and F1-score 0.02995, with a confusion matrix and a precision-recall curve labeled “HBOS Fraud Detection.”

Automated Benchmarking and Selection

The pipeline used the stratified test set to make predictions and calculated:

  • Precision

  • Recall

  • F1-score (main metric due to class imbalance)

  • Area Under the Precision-Recall Curve (AUPRC)

  • Confusion matrix

Zerve created a versioned report that gathered all results into one document, making it easier to compare models. The selection started by looking at the F1-score, then used AUPRC or recall to decide if F1-scores were tied. The best model was saved as a versioned .pkl file for production.

Automated Inference and Retraining

The production system loads the selected model and applies the same preprocessing steps before scoring new data. Scoring can be done either daily in batches or whenever needed.

Here's how it works:

  • Load the chosen model.

  • Preprocess data just like during training.

  • Score incoming data using the preprocessed information.

When new labels are available, the system calculates and records performance metrics with timestamps. If it detects a drop in performance due to changes or feedback, it automatically retrains itself. This helps the system keep up with evolving fraud patterns.

Screenshot of a Zerve notebook block showing Python code that aggregates model metrics and outputs a comparison table. The table lists six unsupervised models: Isolation Forest, One-Class SVM, Autoencoder, Deep SVDD-like, HBOS, and Elliptic Envelope, along with their AUPRC, Precision, Recall, and F1 scores. The Autoencoder and Deep SVDD-like models show the strongest overall performance.
A composite image showing six confusion matrices comparing model performance: Isolation Forest, One-Class SVM, Autoencoder, Deep SVDD-like, HBOS, and Elliptic Envelope. Each matrix visualizes true versus predicted labels for the test set, with most true negatives concentrated in the top-left corner and minimal false positives.
Screenshot of three connected Zerve blocks showing a machine learning workflow for loading test data, restoring a trained model, and evaluating predictions. The outputs display dataset shape, model type (MLPRegressor), and prediction summary including total samples and percentage predicted as fraud.

Productivity Gains

Switching from manual coding to automated orchestration offers many benefits, such as:

  • Time Saving – No need to repeat setup for each retrain

  • Reproducibility – Complete logs of transformations and metrics for every run

  • Consistency – It uses the same rules and thresholds during training and inference

  • Scalability – It is easy to add more models or new data sources

Thoughts on Why This Matters for Fraud Detection

Detecting fraud well means spotting fake activities accurately, acting fast to stop losses, and doing this regularly. Using Zerve's automation tools, we built a system that finds unusual activity quickly with little need for people to step in. This mix of accuracy and speed is key in high risk areas like stopping fraud.

Manual vs. Automated Fraud Detection

AspectWith ZerveWithout Zerve
PreprocessingManual coding of scaling and splitting for each run; prone to inconsistencies.Automated z-score scaling and stratified splitting applied identically across training and inference.
Model BenchmarkingModels tested individually with separate scripts; inconsistent metrics and comparisons.Multiple anomaly detection models benchmarked in one pipeline with standardized metrics and versioned reports.
Metric CollectionMetrics gathered manually; risk of missing or misreporting results.Automated calculation of precision, recall, F1, AUPRC, and confusion matrices, fully logged and reproducible.
Model SelectionManual review to choose the best model; selection criteria may vary.Automated selection based on primary metric (F1), with AUPRC or recall tie breakers applied consistently.
DeploymentRequires manual packaging and setup for each deployment. Best model automatically exported as a versioned .pkl file ready for production.
InferenceNew data processing may not match training pipeline, increasing risk of drift.Identical preprocessing applied to new data before scoring, ensuring consistency.
RetrainingTime consuming; requires re running and re validating the entire workflow manually.Automatic retraining triggered by performance drop or data drift, with minimal intervention.
ScalabilityAdding new models or data sources requires major code changes.Pipeline easily extended to include more models or integrate new data feeds.
Audit & ComplianceLimited or inconsistent logs of past runs.Full transformation, metric, and threshold logs version controlled for compliance.
Engineering EffortHigh – repeated manual coding, tuning, and documentation.Low – retraining and redeployment reduced to a single pipeline run.

Experience Zerve Now

Join our free tier and explore what is possible.

FAQs

What makes fraud detection such a difficult problem?

Fraud cases make up less than 0.2% of transactions, creating extreme class imbalance. Detecting them requires precision, consistency, and scalable automation.

How does Zerve automate the fraud detection workflow?

Zerve standardizes preprocessing, benchmarks multiple models, tracks every metric, and automates retraining when performance drops, ensuring continuous improvement.

Which models were tested for fraud detection?

The workflow compared Isolation Forest, One-Class SVM, Autoencoder, Deep SVDD-style AE, HBOS, and Elliptic Envelope models, selecting the best performer automatically.

How does Zerve maintain accuracy over time?

By monitoring model performance and retraining automatically when results degrade, Zerve adapts to evolving fraud patterns without human intervention.

What are the main advantages of automating fraud detection with Zerve?

Automation improves speed, reproducibility, and scalability while reducing manual effort and ensuring consistent preprocessing, evaluation, and deployment.

K
Kreshnaa Raam
Kreshnaa is Lead Data Scientist at Zerve.
Don't miss out

Related Articles

Build something you can ship

Explore, analyze and deploy your first project in minutes